Make Your Data Pop! How to Design Stunning Bar Charts
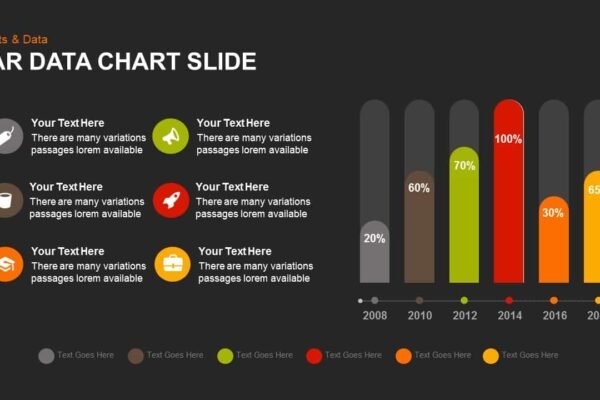
Introduction to Bar Graphs A bar graph, also known as a bar chart, is a visual representation of data using rectangular bars with heights or lengths proportional to the values they represent. Bar graphs are one of the most widely used and effective ways to display and compare different values or quantities. The primary purpose…


